Tuesday, August 24, 2010

August Dissolved Oxygen Survey

NBEP, Brown University and Save the Bay conducted a water quality survey on Thursday, August 19th, and results were much better than expected! The west passage (from the Warwick Neck south to the tip of Jamestown) was well mixed throughout the water column.  The only area our boat saw dissolved oxygen levels below 3.0mg/L (milligrams per liter) was in Greenwich Bay, and even then, only at six of the 14 stations.


NBEP surveys all stations in Greenwich Bay, West Passage and meets up with the Brown boat at the southern station in Upper Bay.

NBEP surveys all stations in Greenwich Bay, West Passage and meets up with the Brown boat at the southern station in Upper Bay.
We not longer survey the Mount Hope Bay or most of the East Passage because low dissolved oxygen levels are rarely found and it is logistically very difficult to cover that area with our three boats. At the end of the summer all data will be posted to the Brown University's Insomniacs website.

Again we found Greenwich Bay to have patches of reddish colored water, and the Sea-bird was giving fairly high flourometry readings (Chlorophyll levels in the water measured in (μg/l, or micrograms per liter) , so we took some water samples with our fine mesh net to analyze back in the lab. Professor David Borkman was kind enough to come help identify the species, which he determined to be Procrocentrum micans, Dinophysis accuminata (not pictured below), and Sanguinium akashiwo.
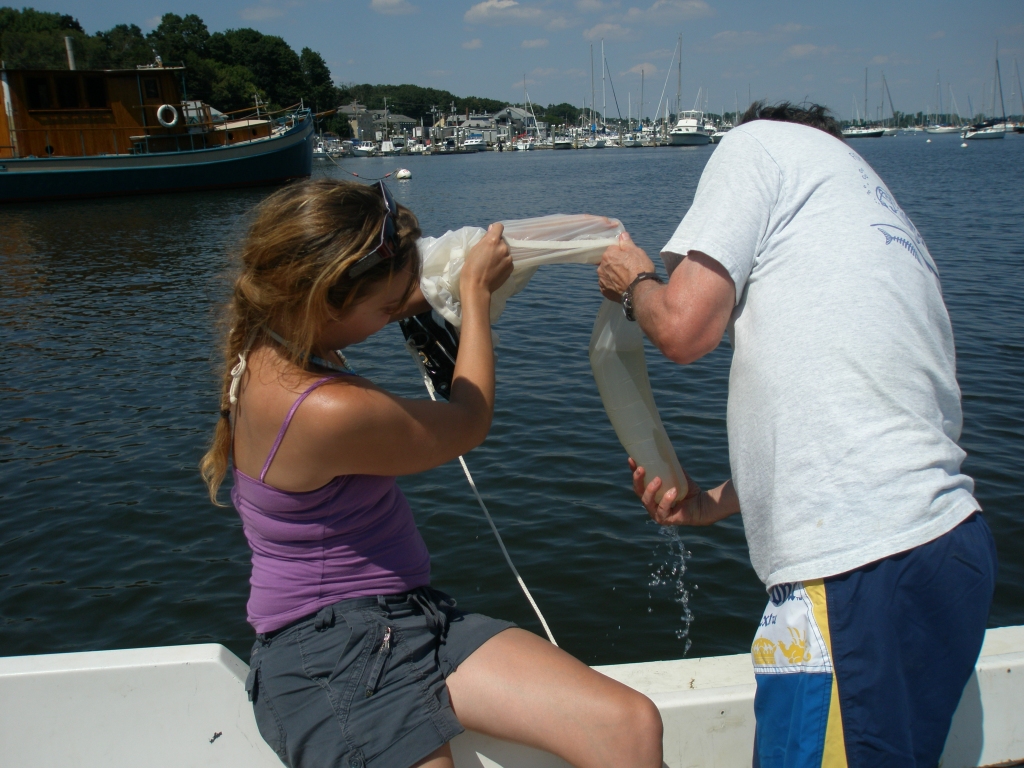

Lesley and Chris collecting a water sample in Greenwich Cove.

Microscopic view of Sanguinium species.


Microscopic view of Prorocentrum species
Most folks know about eelgrass (Zostera marina), and it's benefits to estuarine critters, however, there is another species of seagrass living in Narragansett Bay. While surveying Apponoug Cove in Greenwich Bay, we came across large, floating patches of widgeon grass (Ruppia maritima). There are several species of seagrass found along the Atlantic Coast, however, many species such as turtle grass (Thalassia testudenum), and manatee grass (Syringodium filiforme) are found only in the warmer waters, south of the Chesapeake Bay.

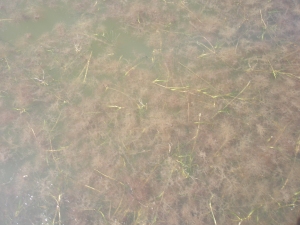
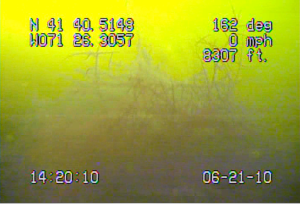
Underwater Video image of a healthy bed of Ruppia maratima at the mouth of Apponaug Cove.

Patch of Rupia floating with seaweeds Polysiphonia and Ceramium in Apponoug Cove.
Patch of R. maratima floating with seaweeds Polysiphonia and Ceramium in Apponaug Cove.

Seagrass is an important estuarine habitat for many reasons. Seagrass beds provide shelter, and feeding grounds for juvenile fish, crabs, shellfish, and birds, and act as a biological filters and erosion control by trapping sediments in its interconnected root structure known as rhizomes. Historically, the southwestern part of Greenwich Bay (Greenwich Cove) was known as Scallop Town because of its healthy beds of shellfish living in and among the seagrass. Unfortunately, seagrass beds have been in decline over the years and efforts to re-vegetate affected areas has had mixed results. Much research has gone into understanding the decline of seagrass beds throughout the Atlantic Coast and globally. Some of the major factors in the decline of seagrass has been attributed to the "wasting disease" of the 1930s, dredging, oil leakage from outboard motorboats, hurricanes, and increased macroalgae due to eutrophication (excessive nutrients in waterways). Boat props can also damage seagrass beds, so it is important to be aware of the area you are boating in, and avoid traveling through an area when you see plant life in your wake.

Friday, August 13, 2010

Biomass Survey

Unfortunately, our aerial survey was canceled this week due to unforeseen circumstances. This however, gave us time to do some biomass estimates. Because we analyze our aerial photography for percent cover of macroalgae, it is important to have a strong understanding of the density, or total biomass for each percent cover classification. Our analysis is based on five density classes (0=no cover, 1= 1-10%, 2=11-40%, 3=41-70%, 4=71-100%). Below you will find an image that helps us identify the density class for each picture.

Each block represents a percent cover which helps us determine the density of algae seen in each aerial photograph.
Everything you will need to do your own biomass estimates!

To measure biomass you will need:
  • 1 quadrat (1/2 meter squared is ideal, but any size will do);
  • Measuring tape;
  • 1 scale (one with a hanging clip that can weigh at up to 500 grams is ideal);
  • Box cutter or razor blade to cut macroalgae overhanging quadrant sample area;
  • Salad spinner to remove excess water from the macroalgae;
  • A zip-lock bag to hold and weigh the sample;
  • paper and pencil to record your readings, and;
  • A camera to capture images of your findings!

Step by step instructions on measuring biomass:
Kids, be sure to have an adult help you out!

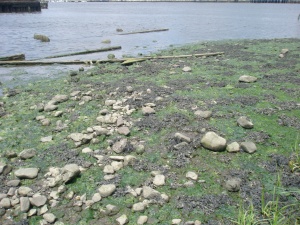
We sampled Sandy Point on Tuesday, and the Wilson Park Fishing Area (pictured here) and Bissel Cove on Wednesday.
First, you will need to select the area you wish to measure. Find a shoreline and define the area by starting at one end, along the water's edge and walking to the opposite end, counting each step (you will need to measure your steps to get exact length). Do the same thing perpendicular to the water's edge and multiply both sides to get the area of your shoreline.

Take your quadrat and drop it at random within your sample area.

Quadrat laid along shore at random.

Using your box cutter or razor blade, cut along the edge of your quadrat to trim away pieces of macroalgae that are not in your selected area. If a piece is only half in your selected area you will need to carefully cut away the section that is not in your area.
Using a razor blade, carefully cut away excess macroalgae from your sample.
Note: Be sure to have an adult help you with the sharp blade!

A salad spinner is the quickest and easiest way to get rid of excess water.
Next, you will need to clean and dry your sample. We use a salad spinner to get rid of excess water, but sometimes we need to clean the sample of sand, snails and shells first. Be sure to remove everything from your sample that is not macroalgae or your readings will be off!

Once you have cleaned and dried your sample you will need to separate it into the different types of macroalgae. Make a pile for each of the classes (green, red and brown)
Our sample has been separated. Notice we did not find any brown algae so only green and red are shown.
Note: distinguishing color can be trickier than you think! A good rule of thumb; dying algae can lose its color, but greens and browns will never look red. Also, there are few browns you will see in the waters of Narragansett Bay and are most often found attached to rocks; if there are bubbles or air pockets on it, it is a brown algae.

Once you have your sample separated, you will need to weigh each sample. First weigh the bag so you can subtract that weight from your total. Weigh each color separately and record your measurements on a piece of paper. Once you have measured all three individually, put all three in the bag and measure the total. This will help verify your measurement and account for any evaporation.
Note: some samples may be too large to measure all in one, so you will need to break it into two part measurements.
Weigh the algae using a hanging scale and plastic bag.

Repeat these steps four more times to get a total of five samples. Using these numbers you will be able to calculate the total biomass of your shoreline. You will need to calculate the area of your shoreline and your quadrat as well as the percent of the total for each color and sample. Below are some equations you will need for your calculations.

Area = length multiplied by height. (Be sure to use consistent measurements, for example meters (m) and centimeters (cm) OR foot (ft) and inches (in) for all calculations.
= length(meters) x height (meters)

Average weight = sum of all samples divided by total number of samples
Grams (g) = {[sample 1(g)] + [sample 2(g)] + [sample 3(g)]} ÷ 3 (samples)

Percent = individual sample weight divided by total sample, multiplied by 100%

% = Green sample (g) ÷ total sample weight (g) x 100 percent

Total cover = total area multiplied by average weight, divided by sample area

= total area of shoreline(meters squared) x average weight (grams)
÷ area of quadrat (meters squared)

Friday, August 6, 2010

August Video Survey

We had another great video survey this week! However, the currents were strong which made getting sediment samples difficult because the sediment grab kept on getting swept on its side, causing it to drag sideways along the seafloor, collecting sediment on the top, rather than closing around a proper sample. For many of the stations four times was the charm!
Dropping the sediment grab.
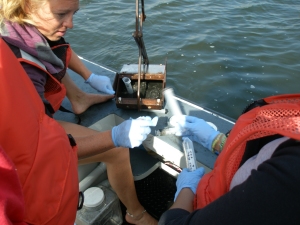
Collecting a sediment sample
Collecting a sediment sample.
An improper sediment grab
(notice the mud sitting on top of the grab).
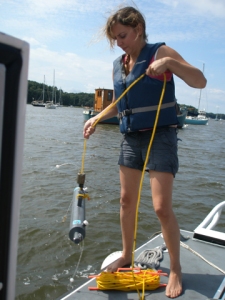
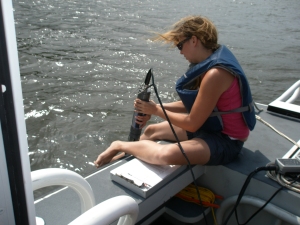
While Shelley, from URI was gathering sediment samples with her crew, Chris and Lesley were collecting water samples, measuring water quality with a YSI at both surface and bottom depths, and dropping the underwater video camera to get a look at the seafloor.
Setting up the underwater video camera.
Lesley collecting a water sample.
Collecting a water sample.
Dropping the YSI for a water quality reading
Dropping the YSI for a water quality reading.
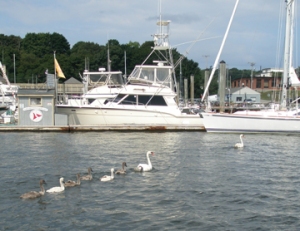
Our survey finished up with a family of swans crossing our path in the Greenwich Bay Marina. Although not as majestic looking, baby swans are hardly ugly ducklings!
Family of Swans crossing the shipping channel in Greenwich Cove.

Thursday, July 29, 2010

July Aerial Survey

The NBEP crew had our third aerial survey Monday July 12th. As expected, many areas of the bay were cloudy with hypoxia and macroalgae was seen just about everywhere. When oxygen levels drop in marine waters sulfur precipitates out, causing the water to become cloudy. The Seekonk River was streaked red with phytoplankton which may be a dinoflagellate or diatom (like the dinoflagellate Gynodinium we found in May), however we were not able to obtain a sample to identify it.
The wrack line at Conimicut was loaded with a filamentous Ulva.
Ground truthing showed expected results: Ulva is heavily coating the northern parts of the Bay, however, the species are changing. While in the past we have seen the big sheets of Ulva (commonly known as sea lettuce) covering beaches, the filamentous Ulva was found in big mats along the shores of Conimicut.

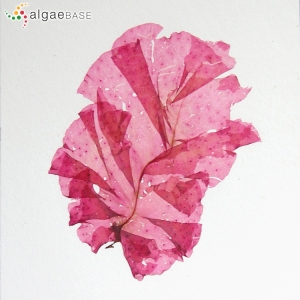
Also, this time last year we were seeing the brown seaweed Punctaria mixed into the Ulva, but this year the red seaweed Grinnellia has taken its place.

Punctaria latifolia. Image: Carol Thornber, URI


Grinnellia americana. Image: algaebase.org

Sunday, July 11, 2010

Seafloor (Benthos) Survey

On June 21, in collaboration with the University of Rhode Island’s Cell & Molecular Biology department, we completed a videotaping survey throughout six different locations in Narragansett Bay.  We will be surveying six locations throughout Greenwich Bay. Click on the map below to see our locations marked in yellow.[googlemaps http://maps.google.com/maps/ms?ie=UTF8&hl=en&msa=0&msid=103382247568443412834.00048af7f4a77de62dac3&t=h&ll=41.671466,-71.435667&spn=0.02943,0.021252&output=embed&w=425&h=350]

Liquid Nitrogen Storage Tank.
Sediment samples
A GPS, in correlation with the program Chartview Pro, was used to track the exact locations that we surveyed so we can return to them each time. At each of the six locations, we used the SeaViewer Underwater camera to capture video clips of the benthic regions in the Bay. We used a YSI to measure temperature, salinity, dissolved oxygen (DO), and chlorophyll at surface and bottom depths (click on yellow icons above to see our readings).  A Niskin water sampler was used to take water samples at the bottom, as well as a sediment grab which plunges into the ground to collect sediment samples. The sediment samples were preserved in a liquid nitrogen storage tank. Both sediment and water samples will be tested by the molecular biology students.

Aghardiella (a red branching seaweed) with
Ulva (green "sea lettuce) underneath.
After viewing the video footage, we found a plethora of interesting marine life living in the sediment in the Bay.  For instance, single-celled algae was found, as well as the red algae Aghardiella species and Gracilaria species. Ctenophores, commonly referred to as “comb jellies” were also abundant at the surface and benthic regions in the Bay.  Amphipods, tunicates, and crabs were among the other species found within the sediment.
Aghardiella (a red branching seaweed)

Wednesday, June 30, 2010

June Aerial Survey

On June 22nd the crew took a helicopter survey and found many areas of Narragansett Bay to be heavily loaded with algae. Some areas, particularly the coves in Greenwich Bay, had a milky hue to them which is indicative of low dissolved oxygen. Much of Greenwich Bay and Allen Harbor had bright red streaks in the water.

The red streaks in the water are patches of the dinoflagellate Gynodinium.
Certain types of phytoplankton (microscopic algae) grow very quickly and form thick, visible patches. Some of these phytoplankton blooms are harmful to plants, animals and humans, and are known as harmful algal blooms (HAB). After we landed we traveled down to Allen Harbor to collect a water sample to take back to the lab and look at under the microscope. Fortunately, the red phytoplankton we saw was not a HAB. A fellow professor here at the URI Bay campus identified it to be a harmless species of Gymnodinium, a dinoflagellate. There are however, several species of Gymnodinuim that produce toxins that cause shellfish poisoning. These red-tide events often coincide with high concentrations of nutrients, especially iron and high temperatures.

For more information on dinoflagellates
go to www.keweenawalgae.mtu.edu/

After our aerial flights we go out to the beaches to identify the algae species seen from the air. As expected, we found the northern part of the Bay (north of Conimicut) loaded with the green algae Ulva species (sea lettuce). Conimicut and many areas south to Narragansett beach have a wide variety of red, green and brown algae.


The green seaweed Ulva and brown seaweed Fucus cover Bold Point.


A mix of reds, greens and browns were found at Sabin point.

Friday, June 11, 2010

Meet the Science Research Team of 2010

Every year NBEP hires at least one intern to help us out with our summer research. Whether we hire through the RI Department of Environmental Management or the University of Rhode Island, our interns must have a strong interest in the environment and have at least two years of higher education schooling in marine or environmental sciences.

The Veterans

Dr. Chris Deacutis

Dr. Chris Deacutis — Has been the Chief Scientist for NBEP since 1993.  Prior to joining the NBEP team, Chris worked with RI Department of Environmental Management in the Division of Water Resources. It was his research and suggestion of hypoxic problems in Narragansett Bay that sparked the efforts of the Insomniacs in 1999. From the summer of 1999 to 2003 Chris organized and coordinated nighttime dissolved oxygen surveys. Since 2004 Chris has been collaborating with Brown University and the University of Rhode Island to conduct daytime dissolved oxygen surveys throughout the summer.


Lesley Lambert
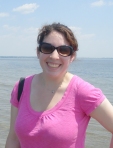
Lesley LambertAfter graduating from Roger Williams University in 2005 with a major in Marine Biology and a minor in Economics, I began working with NBEP in 2006 as an RIDEM intern and had the great fortune to continue with the program, becoming Project Coordinator. I have recently become the Digital Communication Manager, so in addition to conducting the summer research and mentoring our interns, I am now in charge of maintaining our website, designing the Narragansett Bay Journal, and other outreach materials and events.


2010 Interns:

Rebecca Sacks
Rebecca Sacks Becca is a senior at the University of Rhode Island, majoring in Marine Biology. She began working with us during the spring semester while maintaining a full course schedule. In the past four months she has received experience in analyzing aerial photographs as well as algae identification and biomass estimates through ground truthing. We look forward to having Becca on our team and showing her the ropes of working in the local environmental field.


Bart Johnsen-Harris

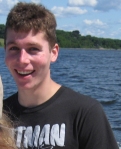
Bart Johnsen-Harris Bart is a Junior at Brown University majoring in Environmental Studies. Aside from his strong interests in environmental policy, he is also an outstanding piccolo player and bass singer for Brown's Wind Symphony and "Bear Necessities" a cappella group. Bart will be assisting us on our boat surveys this summer.


We will post our 2011 interns when they come on board next week!

Thursday, June 10, 2010

First Water Quality Survey of the Summer

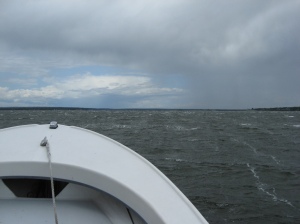
The NBEP science team embarked on our first water quality survey of the season on June 8th. We used the R.I. Department of Environmental Management (RIDEM) boat and left from the East Greenwich Bay Marina. We were able to take measurements at 28 of our 30 fixed sites throughout Greenwich Bay and the west passage of Narragansett Bay before a squall came about and forced us to go in and get out of the inclement weather.
Sudden Bad weather
Sudden Squall

The north western part of Greenwich Bay was found to be just at the hypoxic level at 2.9mg/L of dissolved oxygen. However, the southern parts of Greenwich Bay and much of the rest of the Bay was well mixed and oxygen levels were sufficiently high. The squall likely mixed the water  and oxygenated it further.

Marine animals breath oxygen too and when oxygen levels drop below 3mg/L there is not enough oxygen to go around. Creatures that live on the bottom of the bay such as oysters, littlenecks, and marine worms are at a greater risk during hypoxic events because they cannot move to a different area. Schooling fish such as menhaden are also affected by hypoxia because they are often chased into coves by predators such as striped bass and the school will use up the oxygen faster than it can be produced by photosynthesis or mixed into the water at the surface from the air.

Our next water quality survey will occur in the second week of July, however we hope to do a video survey next week to look at the sediments throughout Greenwich Bay.
Our captain Heather and intern Bart.
Lesley and Becca work on gathering the data.